“Home sales traditionally taper off toward the end of the year, but in September they surged beyond what we normally see during this season,” says Lawrence Yun, NAR’s chief economist. “I would attribute this jump to record-low interest rates and an abundance of buyers in the marketplace, including buyers of vacation homes given the greater flexibility to work from home.”
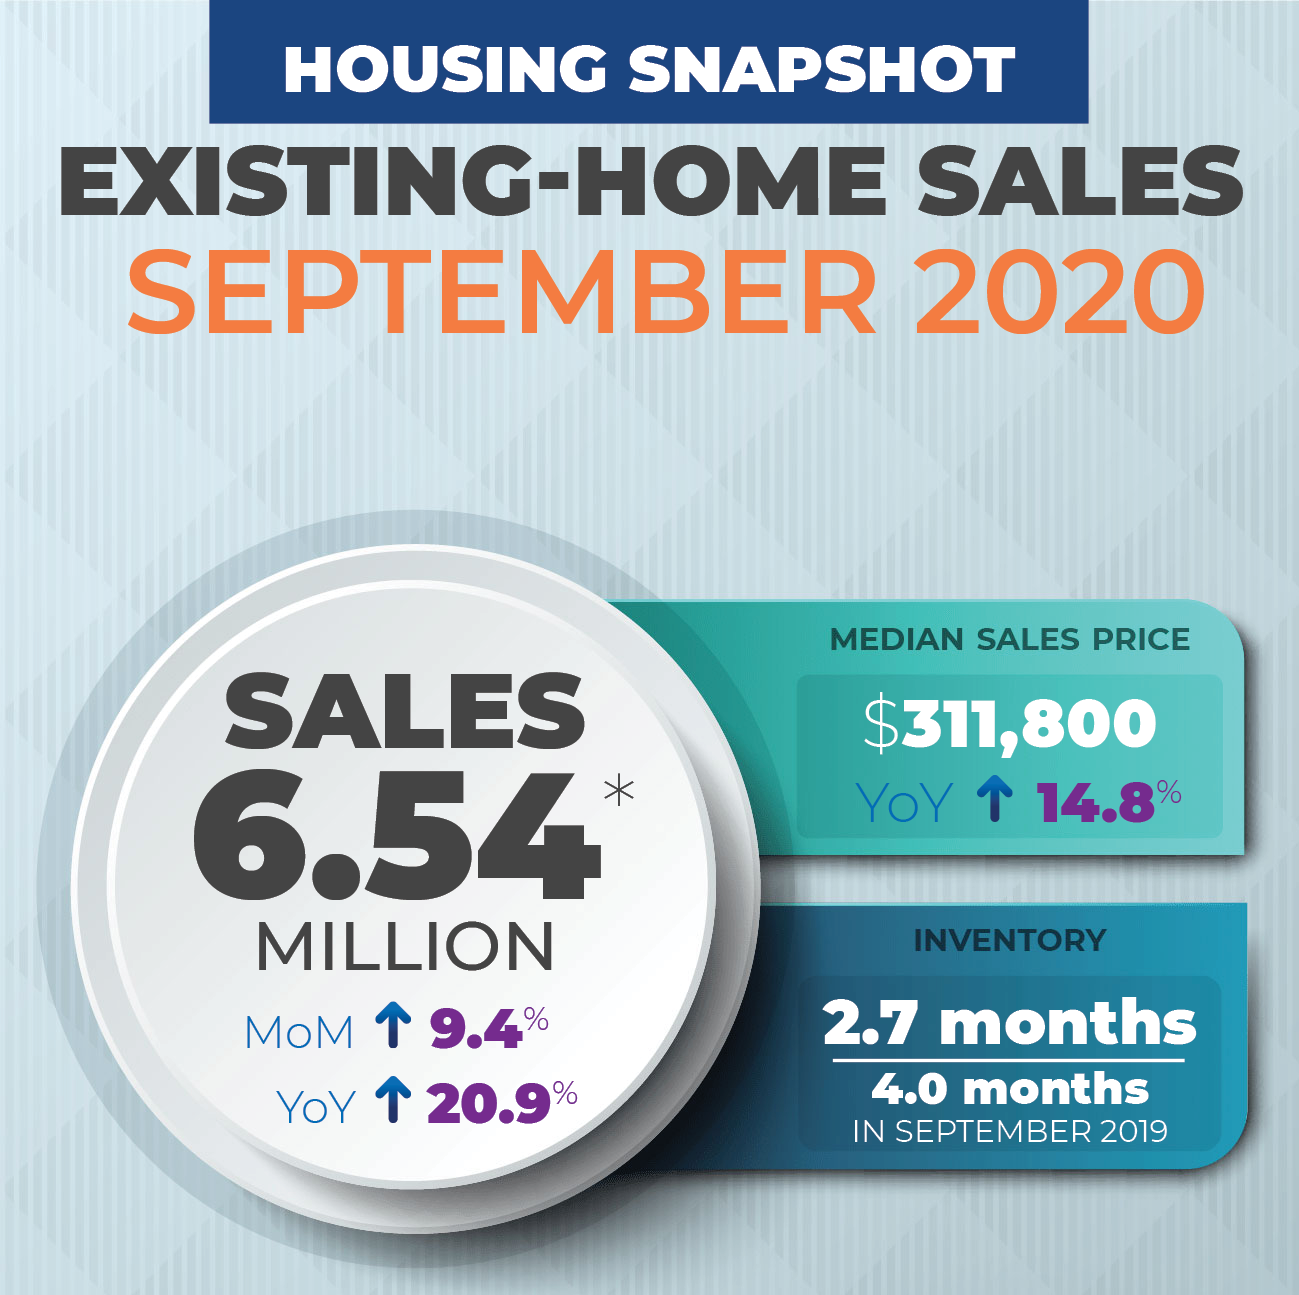
Total existing-home sales—completed transactions that include single-family homes, townhomes, condos, and co-ops—increased 9.4% from August to a seasonally adjusted annual rate of 6.54 million in September, NAR’s index shows.
Home prices continued to surge amid strong buyer demand for housing. The median existing-home price for all housing types in September was $311,800—a 14.8% increase from a year ago ($271,500). Home prices in every region were up last month, NAR reports.
Homebuyers continue to face scant choices. Total housing inventory at the end of September was 1.47 million units, which is down 19.2% compared to a year ago. Unsold inventory sits at a 2.7-month supply at the current sales pace.
“There is no shortage of hopeful, potential buyers, but inventory is historically low,” Yun says. “To their credit, we have seen some homebuilders move to ramp up supply, but a need for even more production still exists.” (Read more: Homebuilding Is Booming, But Is It Enough?)
Vacation hotspots are garnering more attention and sales. Sales in vacation destination counties have accelerated since July—up 34% year over year in September, NAR reports.
“The uncertainty about when the pandemic will end, coupled with the ability to work from home, appears to have boosted sales in summer resort regions, including Lake Tahoe, Mid-Atlantic beaches (Rehoboth Beach, Myrtle Beach), and the Jersey shore areas,” Yun says.
Here are additional indicators from NAR’s latest housing report:
- Days on the market: Seventy-one percent of homes sold in September were on the market for less than a month. Properties typically stayed on the market for just 21 days last month—an all-time low. That is down from 32 days a year ago.
- First-time buyers: First-time homebuyers made up 31% of sales in September, down from 33% a year ago.
- All-cash sales: All-cash sales accounted for 18% of transactions in September, up from 17% in September 2019. Individual investors and second-home buyers tend to make up the biggest bulk of all-cash sales. They purchased 12% of homes in September.
- Distressed sales: Foreclosures and short sales represented less than 1% of sales in September, which is down from 2% a year ago.
- Mortgage rates: The 30-year fixed-rate mortgage continued to set records, decreasing to a 2.89% average in September. Last year, the average 30-year fixed-rate mortgage was 3.94%.
Regional Breakdown
Here’s how existing-home sales fared across the country in September:
- Northeast: Existing-home sales jumped 22.9% compared to a year ago. Median price: $354,600, up 17.8% from September 2019.
- Midwest: Existing-home sales climbed 19.8% compared to a year ago. Median price: $243,100, a 14.8% annual increase.
- South: Existing-home sales rose 22.3% from September 2019. Median price: $266,900, a 13% increase from a year ago.
- West: Existing-home sales surged 18.1% compared to a year ago. Median price: $470,800, up 17.1% from September 2019.
Source: magazine.realtor

